🚀 Portable does more than just ELT. Explore Our AI Orchestration Capabilities
Looker ETL: LookML + ETL Recommendations: NEW (2023)

What is Looker?
Looker is a business intelligence platform that allows for real-time data exploration and analysis. Looker simplifies the process of exploring and utilizing big data for informed decision-making.
Use Case: Looker for SaaS
-
Looker provides data analytics solutions for any SaaS businesses using data.
-
As an example, a SaaS tool for retailers can use Looker to analyze customer data to improve customer experience and sales. Looker provides insights into consumer behavior, preferences and purchasing patterns through interactive dashboards.
Related: Data Infrastructure: Overview, Costs, & Top Integration Tools
Is Looker a data warehouse?
__Looker is a powerful analytics platform that helps organizations unlock insights from their data. Unlike a traditional data warehouse, Looker enables users to connect to and analyze data from various sources. __
LookerML vs SQL:
-
LookerML and SQL are both used in ETL processes in data science and analytics.
-
SQL is a manual coding language widely used with databases, while LookML is designed specifically for use with Looker data.
-
LookML offers added functionalities and is preferred over SQL.
-
It abstracts data logic and calculations into a reusable format, making it easier for non-technical users to perform complex analyses and for data teams to collaborate.
-
LookML also provides tools for collaboration, testing, and version control.
Related: ETL with SQL: Use Cases & How They Work Together
Looker vs Tableau high-level similarities
Tableau is a popular BI tool with a strong market presence.
Looker and Tableau share several similarities, including:
-
Data Connectivity: Both Looker and Tableau can connect to various data sources like spreadsheets, databases, and APIs. However, Looker stands out with its support for over 50 SQL dialects and seamless integration with GCP data (BigQuery, GA4, etc.).
-
Data Transformation: Both tools provide extensive tools for preprocessing and cleaning data, ensuring a smooth data experience for analysts and stakeholders.
-
Data Management: Looker and Tableau both support data management features such as data lineage and tracking, governance, and security.
While both tools have similar features, Looker has stronger data modeling and collaboration capabilities, making it a better choice for BI applications.
Is Looker a BI tool?
Looker is a business intelligence tool that empowers organizations to make informed decisions. It has many data applications like automated reports and dashboards.
Looker: Key Features
Looker comes with a rich pool of features. Understanding Looker's main features are crucial for leveraging data to drive business success. Following are some of the main features of Looker:
-
Blocks and Actions: Looker aims to simplify data analysis and reporting by utilizing Blocks and Actions. You can think of Blocks as optimized SQL code templates. Blocks make it easier for you to handle data and save valuable time and resources. Actions expand Looker's capabilities by enabling integration with third-parties. You can integrate tools like Slack via APIs to fulfill certain business requirements.
-
Alerts: Most data platforms lack the capability to report optimized alerts. With Looker, you can set alerts that will inform relevant stakeholders when a certain condition is met. For instance, you can set an alert for reaching 1000 daily orders).
-
PDT and Incremental PDT: Persistent Derived Tables (PDTs) is a feature in Looker that helps minimize the strain on the database. It accomplishes this by only accessing the data that is required. For big data sets, incremental PDTs are useful as they allow data teams to add new information to the PDT without having to rebuild the entire table. This is similar to the "Incremental Refresh" feature in Power BI and Tableau.
-
Multi-cloud Support: Looker is designed to work with various cloud platforms and CRMs. These include Microsoft Azure, Amazon Web Services (AWS), Google Cloud, and Salesforce. Looker's multi-cloud support allows organizations to use the cloud's scalability and flexibility. Analysts can use their existing data stack to run Looker on cloud platforms and fulfill their business needs.
What is Data Lineage? Why is it useful?
Looker has an additional feature called Data Lineage.
Data Lineage refers to the process of tracing data from its origin to its final destination. It keeps a record of any changes or transformations the data undergoes. Data Lineage is useful because:
-
It allows organizations to trace the path of data. This helps in the identification and resolution of issues that may be affecting data accuracy.
-
It helps organizations track and audit data usage. This ensures that data is being used appropriately and for the intended purpose.
-
It allows for more effective data management by providing a complete view of data processes; you can use this information to optimize data workflows.
How to ETL Data into Looker:
The steps involved in extracting, transforming and loading data into Looker depend on the data source. However, all data sources follow the same general steps for ETL in Looker. Below are the general steps involved in extracting, transforming and loading data into Looker:
-
Connect to a data source: Use Looker's connectors to connect to data sources. The data sources can be a database, a file, or a cloud-based data service(AWS for instance).
-
Define the data model: After connecting to a data source, define the structure and schema of your data. You can do this using LookML.
-
Transform the data: Preprocess, clean and transform the data according to your requirements. You can transform your data using LookML.
-
Load the data: Load the transformed data into Looker. Data analysts can use different load processes. The load processes depend on the amount of data and the reporting frequency.
After loading data, business intelligence analysts can use the visualization capabilities of Looker. They can make dashboards and reports to fulfilling stakeholders' requirements.
Example: ETL Data into Looker from Google Drive
Let's import sample data stored on Google Drive into Looker.
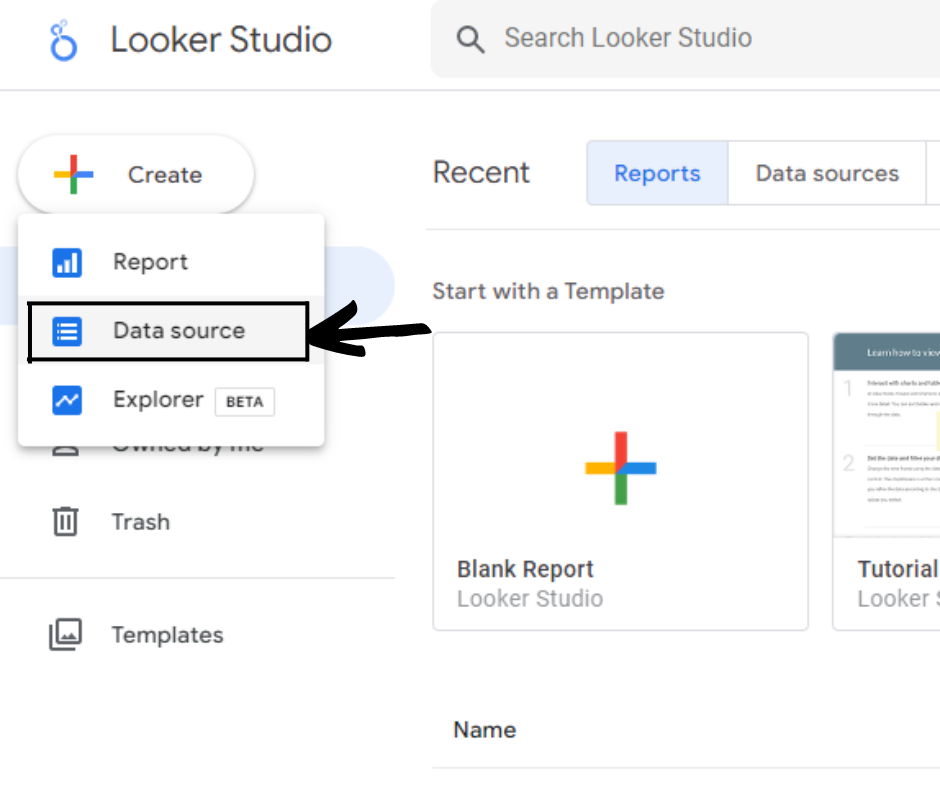
Open up Looker Studio. Once signed in, click on Create at the top left of your screen and select Data source. This allows us to connect looker to a data source.
After clicking Data Source, you will be redirected to a page with a list of connectors. Choose that connector according to your data source. In our example, we will use the Google Sheets connector to connect to the data stored on the Google Drive.
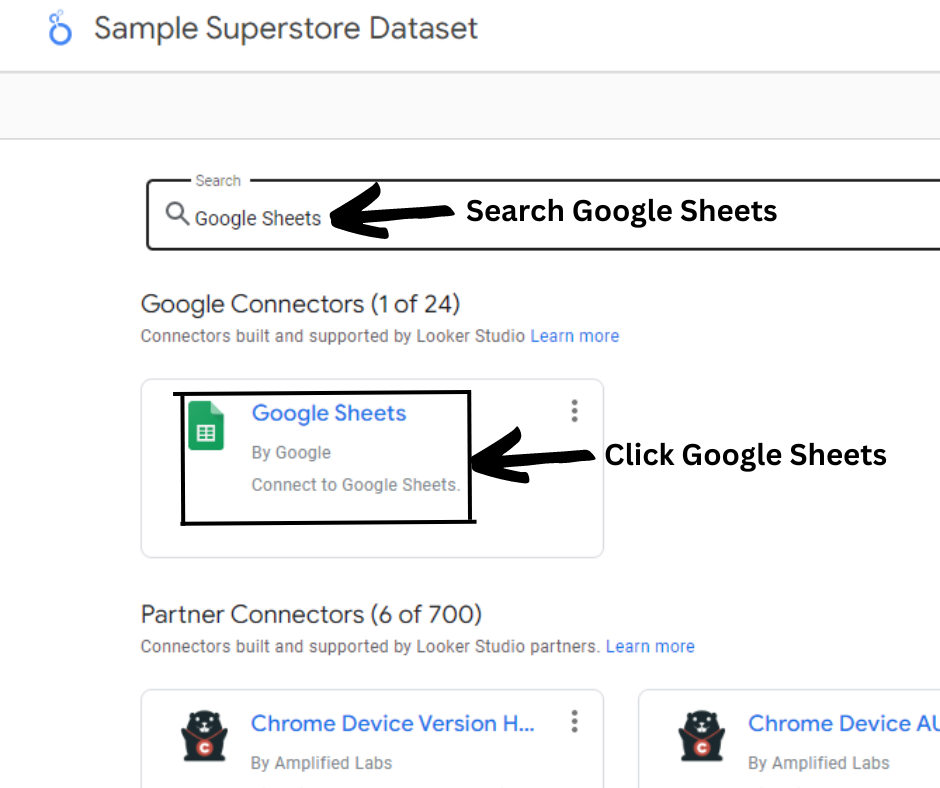
Click on Google Sheets. This will redirect you to the configuration page for the connector.
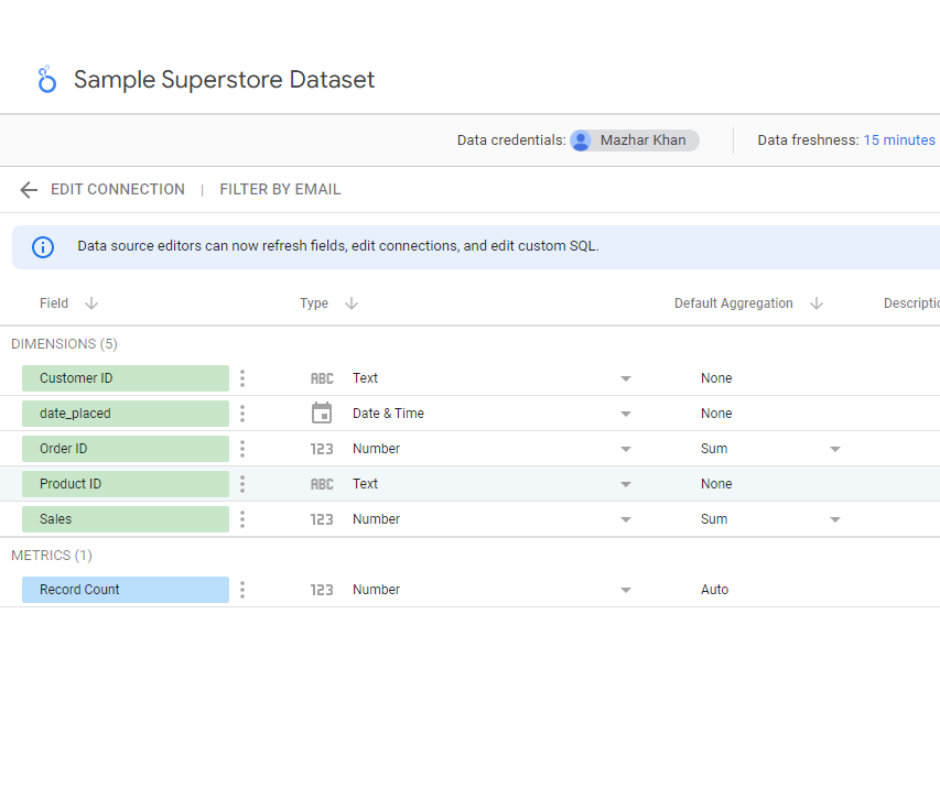
Select the options as shown in the image below, and click Connect at the top right corner of your screen.
Looker will then redirect you to a page where you can clean and transform your data.
After making necessary changes, click on Create Report at the top right of your screen.
Looker will redirect you to the screen shown below. Click on Add to Report to connect your loaded data to a report.
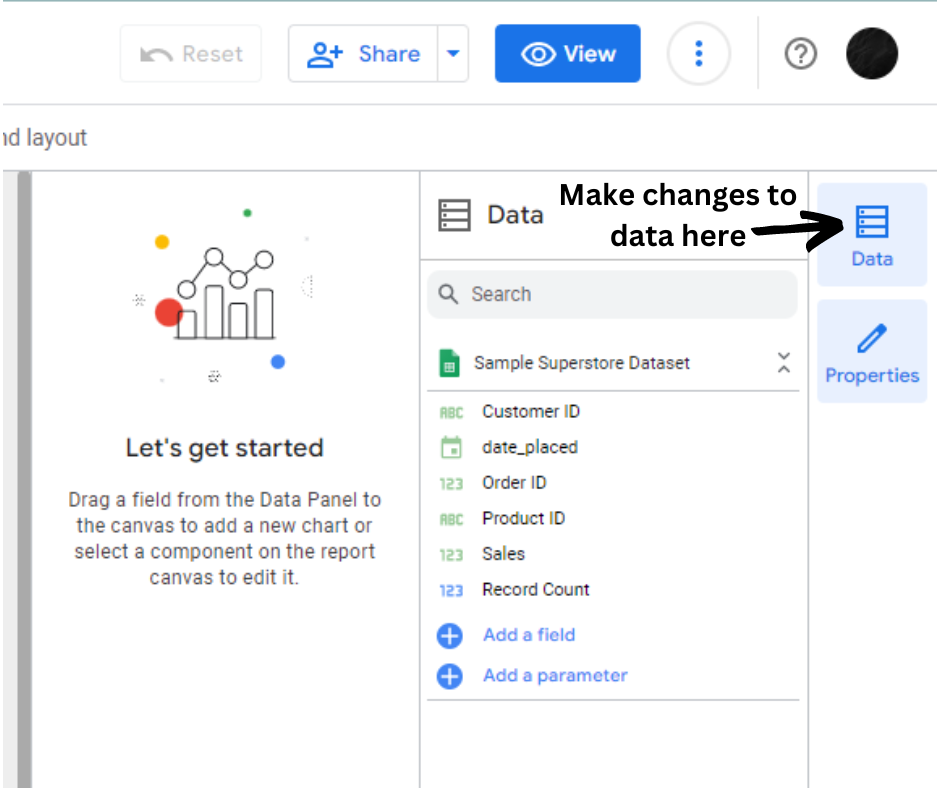
Now that you have your data loaded and added to a report, you can start making visualizations and dashboards to answer questions related to the problem you are solving.
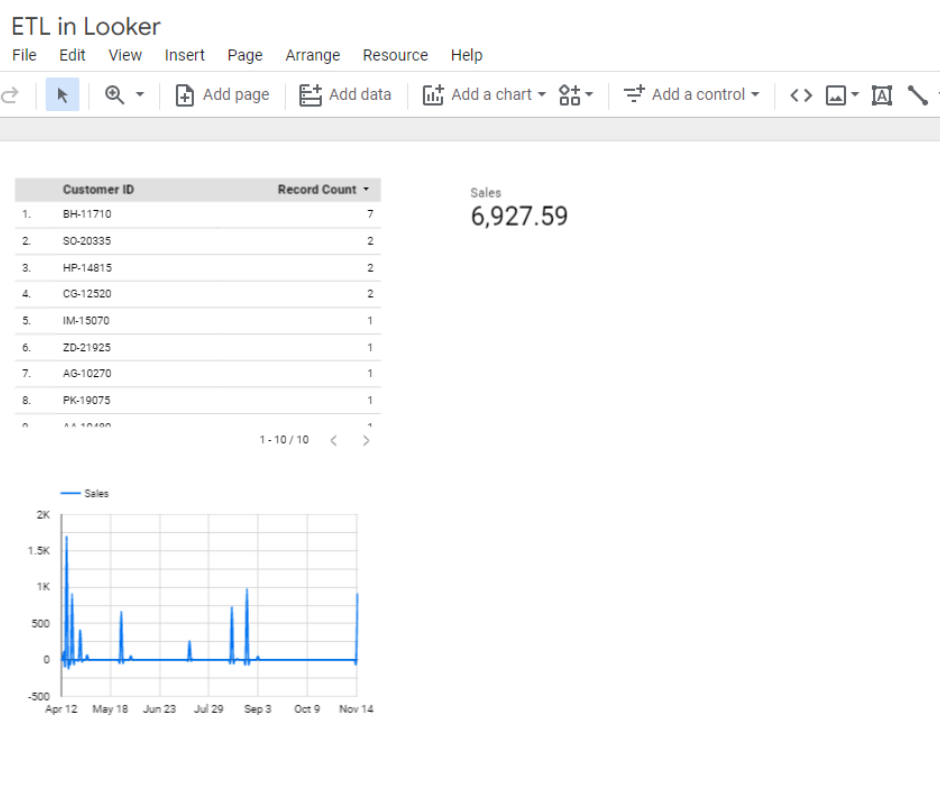
Looker provides a variety of tools to make changes to your data. You can unify all your data sources by clicking the Data icon and adding data from other sources. Once done, you can start sharing it with people in your organization by clicking the Share button.
When to use a dedicated ETL tool?
The decision to use a dedicated ETL tool depends on the following:
-
Complexity and volume of data
-
Number of data sources
-
The specific requirements of an organization.
Suppose an organization has complex data from many sources. Such data requires advanced transformation and cleaning. In this case, a dedicated ETL tool can help handle these tasks before loading data into Looker. This ensures data accuracy, consistency, and high-quality analysis.
Some of the leading dedicated ETL tools are listed below:
1. Portable
Portable is the ideal ETL tool for teams with long-tail data sources. It has built-in connectors for 300+ hard-to-find data sources and adds more regularly.
Even better, the Portable team develops new data connectors upon request with turnarounds in as little as a few hours. And they maintain those connectors if APIs change or datasets are no longer supported.
Pricing
-
Portable offers a free plan for manual data workflows with no caps on volume, connectors, or destinations.
-
For automated data flows, Portable charges a flat fee of $200/month.
-
For enterprise requirements and SLAs, contact sales.
Key features
-
300+ built-in connectors for data sources you won't find with most other ETL tools.
-
Development and maintenance of custom connectors at no cost.
-
Premium support is included on all plans.
Disadvantages
-
Portable focuses on long-tail data connectors and doesn't support major enterprise applications like Oracle or Salesforce.
-
No support for data lakes.
-
Only available to users in the U.S.
Who is Portable best suited for?
Portable is best for teams that can't find connectors for one or more data sources and want a solution that just works.
2. Stitch
Stitch is an ETL tool that's part of the Talend ecosystem. It supports data transformations with Python, Java, SQL, or its no-code GUI.
Pricing
-
Standard plan starting at $100/month for up to 5 million active rows per month, one destination, and 10 sources (limited to "Standard" sources)
-
Advanced plan at $1,250/month for up to 100 million rows and three destinations
-
Premium plan at $2,500/month for up to 1 billion rows and five destinations
-
14-day free trial available
Key features
-
Support for over 130 data sources.
-
Built-in integrations with Talend suite of data tools.
-
Compatible with scripted and GUI-based data transformations.
-
Automations for monitoring and notifications.
Disadvantages
-
Complex data transformations are not as well supported as on some other platforms.
-
On-premise deployments not available.
-
Limits on the number of data sources and destinations.
Who is Stitch best suited for?
Stitch is best for teams using widely used data sources and looking for a tool with basic transformation support.
3. Blendo
Blendo is a data integration tool with several automations to speed up the creation of ETL pipelines. It has scripts and predefined data models.
Pricing
-
Free plan limited to three sources
-
Pro plan starts at $750/month and includes transformations
-
Enterprise plans available with custom pricing
Key features
-
Supports 45+ data sources.
-
No-code platform that's ideal for nontechnical teams.
-
Built-in monitoring and alert features.
Disadvantages
-
Not as many data connectors as other ETL tools.
-
Limited data transformation functionality.
-
Teams can't create new data connectors on their own.
Who is Blendo best suited for?
Data teams with a small number of sources and no transformation needs looking for an easy-to-use platform.